
Weltweite PC-Auslieferungen gingen im zweiten Quartal 2017 um 4,3 Prozent zurück.
Globale PC-Auslieferungen sinken das elfte Quartal in Folge.
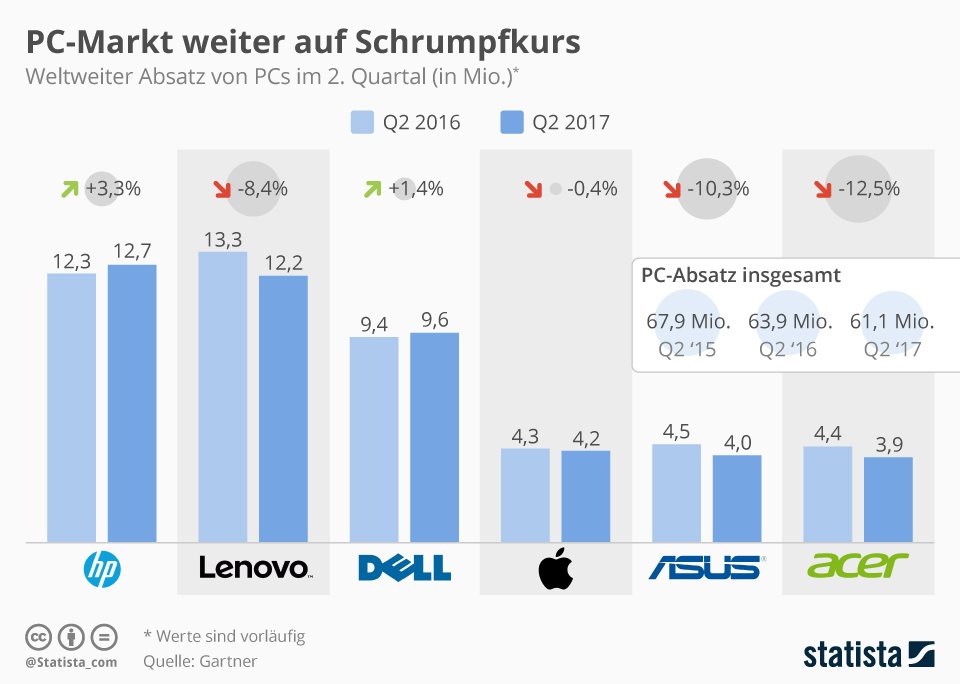
https://de.statista.com/infografik/1036/weltweiter-pc-absatz/
Im zweiten Quartal 2017 beliefen sich die weltweit PC-Auslieferungen auf rund 61,1 Millionen PCs, dies entspricht einem Rückgang von 4,3 Prozent gegenüber dem zweiten Quartal 2016, so das IT-Research und Beratungsunternehmen Gartner. Die PC-Branche befindet sich in einem fünf Jahre andauernden Rückgang. Dies ist das elfte Quartal in Folge mit sinkenden Auslieferungszahlen. Die Zahl der Auslieferungen im zweiten Quartal dieses Jahres war die niedrigste seit 2007.
»Die höheren PC-Preise, die aus der Knappheit der Komponenten für DRAM, Solid-State-Drives und LCD-Panels resultierten, hatten negative Auswirkungen auf die Nachfrage für PCs im zweiten Quartal 2017«, sagte Mikako Kitagawa, Principal Analyst bei Gartner. »Die Hersteller gingen dabei unterschiedlich mit den gestiegenen Kosten für Komponenten um. Manche entschieden sich, die höheren Komponentenkosten selbst zu tragen ohne den Gerätepreis zu erhöhen – andere Anbieter schlugen die Kosten auf den Endpreis für Verbraucher auf.«
Gartner Says Worldwide PC Shipments Declined 4.3 Per Cent in Second Quarter of 2017
Global PC Shipments Decrease for 11th Straight Quarter
STAMFORD, Conn., July 12, 2017 — Worldwide PC shipments totalled 61.1 million units in the second quarter of 2017, a 4.3 per cent decline from the second quarter of 2016, according to preliminary results by Gartner, Inc. The PC industry is in the midst of a five year slump, and this is the 11th straight quarter of declining shipments. Shipments in the second quarter of this year were the lowest quarter volume since 2007.
»Higher PC prices due to the impact of component shortages for DRAM, solid state drives and LCD panels had a pronounced negative impact on PC demand in the second quarter of 2017,” said Mikako Kitagawa, principal analyst at Gartner »The approach to higher component costs varied by vendor. Some decided to absorb the component price hike without raising the final price of their devices, while other vendors transferred the costs to the end-user price.”
However, in the business segment, vendors could not increase the price too quickly, especially in large enterprises where the price is typically locked in based on the contract, which often run through the quarter or even the year,” Ms Kitagawa said. »In the consumer market, the price hike has a greater impact as buying habits are more sensitive to price increases. Many consumers are willing to postpone their purchases until the price pressure eases.”
HP Inc. reclaimed the top position from Lenovo in the worldwide PC market in the second quarter of 2017 (see Table 1). HP Inc. has achieved five consecutive quarters of year-over-year growth. Shipments grew in most regions, and it did especially well in the US market where its shipments growth far exceeded the regional average.
Table 1
Preliminary Worldwide PC Vendor Unit Shipment Estimates for 2Q17 (Thousands of Units)
| Company | 2Q17 Shipments | 2Q17 Market Share ( %) | 2Q16 Shipments | 2Q16 Market Share ( %) | 2Q17-2Q16 Growth ( %) |
| HP Inc. | 12,690 | 20.8 | 12,285 | 19.2 | 3.3 |
| Lenovo | 12,188 | 19.9 | 13,305 | 20.8 | -8.4 |
| Dell | 9,557 | 15.6 | 9,421 | 14.7 | 1.4 |
| Apple | 4,236 | 6.9 | 4,252 | 6.7 | -0.4 |
| Asus | 4,036 | 6.6 | 4,501 | 7.0 | -10.3 |
| Acer Group | 3,850 | 6.3 | 4,402 | 6.9 | -12.5 |
| Others | 14,546 | 23.8 | 15,710 | 24.6 | -7.4 |
| Total | 61,105 | 100.0 | 63,876 | 100.0 | -4.3 |
Notes: Data includes desk-based PCs, notebook PCs and ultramobile premiums (such as Microsoft Surface), but not Chromebooks or iPads. All data is estimated based on a preliminary study. Final estimates will be subject to change. The statistics are based on shipments selling into channels. Numbers may not add up to totals shown due to rounding.
Source: Gartner (July 2017)
Lenovo’s global shipments declined 8.4 per cent in the second quarter of 2017, after two quarters of growth. Lenovo recorded year-over-year shipment declines in all key regions. Ms Kitagawa said the 2Q17 results could reflect Lenovo’s strategic shift from unit share gains to margin protection. The strategic balance between share gain and profitability is a challenge for all PC vendors.
Dell achieved five consecutive quarters of year-on-year global shipment growth, as shipments increased 1.4 per cent in 2Q17. Dell has put a high priority on PCs as a strategic business. Among the top three vendors, Dell is the only vendor which can supply the integrated IT needs to businesses under the Dell Technologies umbrella of companies.
In the US, PC shipments totalled 14 million units in the second quarter of 2017, a 5.7 per cent decline from the second quarter of 2016 (see Table 2). The US market declined due to weak consumer PC demand. The business market has shown some consistent growth, while early indicators suggest that spending in the public sector was on track with normal seasonality as the second quarter is typically the peak PC procurement season. However, the education market was under pressure from strong Chromebook demand.
The Chromebook market has been growing much faster than the overall PC market. Gartner does not include Chromebook shipments within the overall PC market, but it is moderately impacting the PC market. Worldwide Chromebook shipments grew 38 per cent in 2016, while the overall PC market declined 6 per cent.
»The Chromebook is not a PC replacement as of now, but it could be potenzially transformed as a PC replacement if a few conditions are met going forward,« Ms Kitagawa said. »For example, infrastructure of general connectivity needs to improve; mobile data connectivity needs to become more affordable; and it needs to have more offline capability.”
Table 2
Preliminary US PC Vendor Unit Shipment Estimates for 2Q17 (Thousands of Units)
| Company | 2Q17 Shipments | 2Q17 Market Share ( %) | 2Q16 Shipments | 2Q16 Market Share ( %) | 2Q17-2Q16 Growth ( %) |
| HP Inc. | 4,270 | 30.5 | 4,008 | 27.0 | 6.5 |
| Dell | 3,874 | 27.7 | 3,801 | 25.6 | 1.9 |
| Lenovo | 1,848 | 13.2 | 2,207 | 14.9 | -16.3 |
| Apple | 1,649 | 11.8 | 1,825 | 12.3 | -9.6 |
| Asus | 447 | 3.2 | 754 | 5.1 | -40.7 |
| Others | 1,921 | 13.7 | 2,257 | 15.2 | -14.9 |
| Total | 14,009 | 100.0 | 14,852 | 100.0 | -5.7 |
Notes: Data includes desk-based PCs, notebook PCs and ultramobile premiums (such as Microsoft Surface), but not Chromebooks or iPads. All data is estimated based on a preliminary study. Final estimates will be subject to change. The statistics are based on shipments selling into channels. Numbers may not add up to totals shown due to rounding.
Source: Gartner (July 2017)
PC shipments in EMEA totalled 17 million units in the second quarter of 2017, a 3.5 per cent decline year over year (see Table 3). There were mixed results across various countries. Uncertainty around the UK elections meant some UK businesses delayed buying, especially in the public sector. In France, consumer confidence rose more than expected after Emmanuel Macron was elected president, however spending on PCs remains sluggish. PC shipments increased in Germany as businesses invest in Windows 10 based new hardware, and the Russian market continued to show improvement driven by economic stabilisation.
Table 3
Preliminary EMEA PC Vendor Unit Shipment Estimates for 2Q17 (Thousands of Units)
| Company | 2Q17 Shipments | 2Q17 Market Share ( %) | 2Q16 Shipments | 2Q16 Market Share ( %) | 2Q17-2Q16 Growth ( %) |
| HP Inc. | 4,137 | 24.3 | 4,117 | 23.4 | 0.5 |
| Lenovo | 3,433 | 20.2 | 3,337 | 18.9 | 2.9 |
| Dell | 1,703 | 10.0 | 1,888 | 10.7 | -9.8 |
| Asus | 1,666 | 9.8 | 1,935 | 11.0 | -13.9 |
| Acer Group | 1,625 | 9.6 | 1,646 | 9.3 | -1.3 |
| Others | 4,446 | 26.1 | 4,706 | 26.7 | -5.5 |
| Total | 17,010 | 100.0 | 17,629 | 100.0 | -3.5 |
Notes: Data includes desk-based PCs, notebook PCs and ultramobile premiums (such as Microsoft Surface), but not Chromebooks or iPads. All data is estimated based on a preliminary study. Final estimates will be subject to change. The statistics are based on shipments selling into channels. Numbers may not add up to totals shown due to rounding.
Source: Gartner (July 2017)
In Asia/Pacific, PC shipments surpassed 21.5 million units in the second quarter of 2017, down 5.1 per cent from the same period last year. The PC market in this region was primarily affected by market dynamics in India and China. In India, the pent up demand after the demonetisation cooled down after the first quarter, coupled with the absence of a large tender deal compared to a year ago and higher PC prices, brought about weak market growth. The China market was hugely impacted by the rise in PC prices due to the component shortage
These results are preliminary. Final statistics will be available soon to clients of Gartner’s PC Quarterly Statistics Worldwide by Region programme. This programme offers a comprehensive and timely picture of the worldwide PC market, allowing product planning, distribution, marketing and sales organisations to keep abreast of key issues and their future implications around the globe.
Hier folgt eine Auswahl an Fachbeiträgen, Studien, Stories und Statistiken die zu diesem Thema passen. Geben Sie in der »Artikelsuche…« rechts oben Ihre Suchbegriffe ein und lassen sich überraschen, welche weiteren Treffer Sie auf unserer Webseite finden.
Führende PC-Hersteller müssen sich neu erfinden oder bis 2020 den Markt verlassen
Xplore setzt seit 20 Jahren neue Maßstäbe bei robusten Tablet-PCs